Linux Top command is a performance monitoring program that is used frequently by many system administrators to monitor Linux performance and it is available under many Linux/Unix-like operating systems.
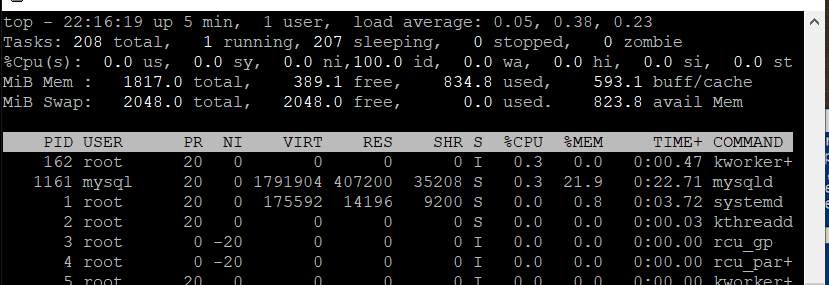
The top command is used to display all the running and active real-time processes in an ordered list and updates it regularly. It displays CPU usage, Memory usage, Swap Memory, Cache Size, Buffer Size, Process PID, User, Commands, and much more.
It also shows high memory and cpu utilization of running processes. The top command is much useful for system administrators to monitor and take corrective action when required. Let’s see the top command in action.
´# top
Here:
- PID: Shows task’s unique process id.
PR: Stands for priority of the task.
SHR: Represents the amount of shared memory used by a task.
VIRT: Total virtual memory used by the task.
USER: User name of owner of task.
%CPU: Represents the CPU usage.
TIME+: CPU Time, the same as ‘TIME’, but reflecting more granularity through hundredths of a second.
SHR: Represents the Shared Memory size (kb) used by a task.
NI: Represents a Nice Value of task. A Negative nice value implies higher priority, and positive Nice value means lower priority.
%MEM: Shows the Memory usage of task.